Vol. 2025, Issue 7 - Builders Outlook
Vol 2025 - Issue 7

By Robin Rothstein, Forbes.com
The spring home-buying season died on the vine. However, there are some signs that sales activity could heat up this summer. Here’s a look at what’s happening in the housing market.
Existing-Home Sales
Existing-home sales, which include completed transactions of single-family homes, townhomes, condominiums and co-ops, struggled to eke out a positive reading amid steep mortgage rates, record-high home prices and economic jitters.
The National Association of Realtors (NAR) reported that monthly sales rose just 0.8% in May, putting the seasonally adjusted annual sales rate at 4.03 million, up slightly from 4 million in April. Year-over-year sales slid 0.7%.
While sales remained anemic, inventory maintained its upward trajectory, reaching its highest level in five years.
Resale housing stock jumped 9% from the previous month and 20.3% from a year ago. Existing unsold inventory stands at a 4.6-month supply at the current monthly sales pace, up from 4.4 months in April. Most experts consider a balanced market to be between four and six months.
Meanwhile, home price growth continues, though the pace is decelerating. The national median resale home price rose 1.3% from a year ago to $422,800, marking the highest May on record and the 23rd straight month of year-over-year price growth.
However, regional price disparities remain pronounced. For example, the median resale home price in the Midwest rose 3.4% from a year ago to $326,400, compared to the West, which rose 0.5% to $633,500.
New Home Sales
Sales of newly built homes took a notable dip in May. The latest U.S. Census Bureau and U.S. Department of Housing and Urban Development (HUD) data revealed that seasonally adjusted new home sales decreased 13.7% between April and May, and 6.3% compared to last year.
Only the Northeast saw a monthly and annualized sales increase, while the Midwest, South and West recorded decreases.
Monthly inventory rose from 8.3 months to 9.8 months supply, which also surpasses the 8.5-month level recorded a year ago.
“Taken together, increases in inventory and month’s supply, mirror the trend of softening demand in the existing home sale market,” said Jake Krimmel, senior economist at Realtor.com, in an emailed statement.
“Whether the new and existing home sale markets continue to move in tandem will be something to watch going forward this summer.”
Yet, even as sales slumped, prices edged higher. The median new home sales price rose by 3.7% in May to $426,600 and 3% from a year ago, according to the data.
Pending Home Sales
While new and existing-home sales were subdued, a rise in contract signings provided some optimism.
NAR’s Pending Homes Sales Index rose 1.8% between April and May, with all four U.S. regions posting monthly increases. Compared to last year, pending transactions were up 1.1%, with the Midwest and South posting gains, while the Northeast and West recorded declines.
A pending home sale marks the point in the purchase transaction when the buyer and seller agree on price and terms and is considered a leading indicator of a closed existing home sale within the next one to two months.
So, how promising is this reading? Could it be that a housing market turnaround is finally around the corner?
“On one hand, May’s pending home sale increase could be a sign of buyers finally beginning to get off the sidelines as the market balances,” Krimmel said. “On the other, interest rates have been steadily rising throughout the spring home-buying season, and with the Federal Reserve holding steady, this could continue into the summer months.”
Housing Inventory Forecast: When Will There Be Sufficient Supply To Reduce Prices?
After several years of record-low inventory, the supply of homes has risen notably over the past year. If the trend continues, buyers sidelined by affordability challenges may find themselves with more options—as long as they know where to look.
Here are factors impacting the inventory landscape.
The Lock-In Effect is Beginning To Unlock
Rick Sharga, founder and CEO of CJ Patrick Company, a market intelligence and business advisory firm, tells Forbes Advisor that inventory is up over 33% from 2024 and appears to be on track to hit pre-pandemic levels by the end of the year, or possibly earlier.
There are multiple reasons for this improvement, one of which is the loosening of the “lock-in effect,” a situation where homeowners with ultra-low rates—such as the high-2% to 4% rates seen during the pandemic years—are disincentivised to sell due to their rates being well below current levels.
“Rate lock is still a legitimate concern, but becoming less of an issue over time,” says Sharga.
Indeed, according to real estate tech company Redfin, 82.8% of homeowners today have rates below 6% down from a high of 92.7% in mid-2022.
However, there are still many homeowners sitting on a good rate who need a major life event reason to sell, such as a job transfer, job loss, marriage, divorce or death, says Sharga.
What’s Driving the Inventory Growth? It Depends on the Region
The overall market still slightly favors sellers, as supply remains near the lower end of what’s considered a balanced market.
However, inventory levels vary widely by region. Markets like Austin and San Antonio, Texas, and Tampa, Florida, where prices surged during the pandemic, are seeing increased supply and slowing price growth.
“[T]here are a number of states, particularly Florida and Texas, which already have more for sale inventory than they did prior to the pandemic, and where demand has weakened,” says Sharga. “In those areas, the market is tilting in favor of buyers.”
On the flip side, areas in the Midwest and parts of the Northeast—such as Buffalo and Rochester, New York, Cleveland and Pittsburgh—that didn’t experience skyrocketing price increases and a surge in newly-built homes have lower inventory and face increased competition among buyers.
How Declining Mortgage Rates Could Impact Supply, Home Prices
Given the pent-up demand for homes, a decline in mortgage rates—especially a sharp one—could quickly shrink housing supply.
“We’re in an incredibly rate-sensitive environment today, and every time we’ve seen mortgage rates drop into the low-to-mid 6% range, we’ve seen an influx of buyers hit the market,” says Sharga.
Sharga adds that rates dropping to 6% would likely motivate more homeowners to sell. Even so, he says many buyers will still be shut out of the market due to other rising home-related costs.
“[H]ome prices have gone up almost 50% over the past five years, property taxes have risen along with them, and homeowner’s insurance premiums rose by 24% between 2020-2024,” says Sharga. “So even though there’s definitely some pent-up demand, a one-point dip in mortgage rates probably wouldn’t bring so many buyers to market that it would overwhelm the supply and cause another huge spike in home prices.”
And speaking of home prices, here’s what the latest home values look like around the country.
Trade Policies and Economic Uncertainty Drag Down Builder Sentiment, New Home Construction
Builder sentiment declined again and new single-family housing starts slipped, as economic volatility and elevated mortgage rates continue to deter buyers and pressure builders.
Builder Confidence Sinks As Resale Inventory Grows and Buyers Pull Back
Builder sentiment continues to erode. The National Association of Home Builders (NAHB)/Wells Fargo Housing Market index dropped from 34 to 32 in June—the third lowest reading since 2012—thanks to trade policy headwinds, elevated mortgage rates and economic jitters. A reading of 50 or above means more builders see good conditions ahead for new construction.
The last time a reading was above 50 was April 2024.
However, bad news for builders is turning out to be good news for shoppers hoping to purchase a newly-built home.
“To help address affordability concerns and bring hesitant buyers off the fence, a growing number of builders are moving to cut prices,” Hughes said.
Indeed, the portion of builders offering price cuts in June rose from 34% in May to 37%, the highest figure since 2022, when NAHB began tracking this data monthly.
Builders have also been feeling the squeeze from the growing supply of resale homes, which has driven down existing-home prices, and added pressure on new home prices and sales.
New Home Starts Decline Amid Economy Worries, Tariffs and Buyer Pullback
Prospective home buyers, take heed: A slowdown in new construction activity appears to be underway.
Single-family housing starts edged up 0.4% in May from the previous month but dropped 7.3% from a year ago, according to the latest U.S. Census Bureau and HUD data. Completions jumped 8.1% from April to May, but were essentially flat compared to a year ago.
The decline in annualized housing starts coupled with sinking builder sentiment suggests buyers may face a smaller selection—and increased competition—this time next year.
Read full article here: https://www.forbes.com/advisor/mortgages/real-estate/housing-market-predictions/
|
|


2025 Pushes along:
Builders face affordability challenges, Texas communities rebuild
As we move deeper into the year, Texas homebuilders continue to face a complex mix of opportunities and challenges that are shaping our market and our mission.
One of the most pressing topics at the moment is the state of the mortgage landscape. While interest rates have stabilized somewhat, affordability remains a key concern across Texas. Many buyers, especially first-time homeowners, are still struggling with elevated monthly payments due to higher borrowing costs and insurance premiums. Lenders are also tightening underwriting requirements, which further complicates the path to homeownership. As builders, we’re being called to innovate; not just in construction methods, but in how we collaborate with lenders, city officials, and housing advocates to create viable solutions for all segments of our community.
At the same time, we cannot ignore the impact of the recent devastating floods across Texas. While El Paso was largely spared the worst of the storm systems, many regions across our state including Houston and Central Texas, saw severe destruction to homes, roads, and infrastructure. Our hearts are with those affected, and the building industry has once again stepped up with supplies, volunteer efforts, and expertise to aid in the rebuilding.
These floods are a powerful reminder of the importance of resilient design and proactive land use planning. As our climate patterns continue to shift, we must lead the way in promoting flood-resistant construction and advocating for infrastructure improvements that protect communities long-term. Builders are not just constructing homes, we are shaping the future of safety, sustainability, and quality of life.
Despite these challenges, I remain inspired by the strength and resilience of our members. Across El Paso and beyond, builders are adapting, finding creative financing solutions, embracing smarter designs, and advocating for policies that support growth. We must continue working together, public and private sectors alike, to ensure Texas remains a place where families can put down roots with confidence and pride.
Let’s keep pushing forward, brick by brick, knowing that what we build today will stand strong for generations to come.
 |
Executive Message • RAY ADAUTO

Floods devastate families
Texas and New Mexico still reeling from horrific losses
The news from central Texas and Southern New Mexico has been devastating. The Guadalupe River and the floods from rain in Ruidoso have hit communities we know well. The massive water surge in Kerr County has killed over a hundred people as of printing, and with over one hundred and seventy people missing, this tragedy may be one of the worst ever in that area. The area is known as “flash flood alley,” which is so dangerous that those living there can recall other floods in the past. News reports don’t tell you the whole picture, but even those reports contain chilling stories of death and survival.
July Fourth is a celebration day, and many folks traveled to camp near or at the river. “As a kid, I can tell you a lot of stories about the camps we’re hearing about,” life member John Chaney told us. “Those kids who were at Camp Mystic really had no chance with that raging river,” he continued. It will take years to rebuild this area, and helping with that will be our fellow Texas Association of Builders members. The state association has made the Texas Builders Foundation a collection point for monetary donations.
Ruidoso’s flooding happened at an unfortunate time, coinciding with the floods in Texas. The severity of the Ruidoso floods was equally devastating, with the loss of life, including two children from one family, and an unknown number of deaths as time moves on. The seriousness of the economic loss comes after other disasters, including fires and more. Ruidoso is home to many, but like Kerrville, the temporary or vacation population has added its own problems for permanent residents. Ruidoso also endures being second to the national or worldwide news. That unfortunately also means the flow of money is focused on Central Texas when it comes to financial attention.
Our friends and families that own property in Ruidoso need help, and we’ll share that info as we get it. But one thing we know is that “things” are replaceable; lives are not. Our prayers go out to all who have suffered from these events, and we hope their lives will find solace in the help they receive.
 |
DEVELOPMENT OUTLOOK
Shrinking Lots: Spec Building New Norm
By Natalia Siniavskaia
The share of smaller lots remained record high in 2024, with two out of three new single-family detached homes sold occupying lots under 9,000 square feet (1/5 of an acre or less). Moreover, a high share of 40% occupied lots under 7,000 square feet (or less than 1/6 of an acre). These shares match the record highs established a year earlier, according to the latest Survey of Construction (SOC). Analysis of a quarter-century of SOC data reveals stark changes in the lot size distribution and documents a dramatic shift towards more compact building over the last two decades.
In 1999, when the Census Bureau started tracking these series, less than half (46%) of new for-sale single-family detached homes occupied lots under 9,000 square feet. The share of these smaller lots fluctuated around 48%, never crossing the 50% mark, until 2011. A shift in speculatively built (or spec) home building towards smaller lots first became noticeable during the anemic housing recovery that followed the Great Recession. Over that period, the share of spec homes built on lots smaller than or equal to one-fifth of an acre rose rapidly, from 47% in 2010 to 61% right before the pandemic.
The trend towards more compact spec building continued during the post-pandemic housing boom, with the share of smaller lots gaining an additional 4 percentage points during the last five years. The persistent shift towards building spec homes on smaller lots is seemingly harder to explain against the backdrop of the pandemic-triggered suburban flight and presumed shifts in preferences towards more spacious living. Less indicative of changing consumer preferences or the residential business cycle, the steadily rising share of spec homes built on smaller lots undoubtedly reflects unprecedented lot shortages confronted by home builders and their attempts to make new homes more affordable.
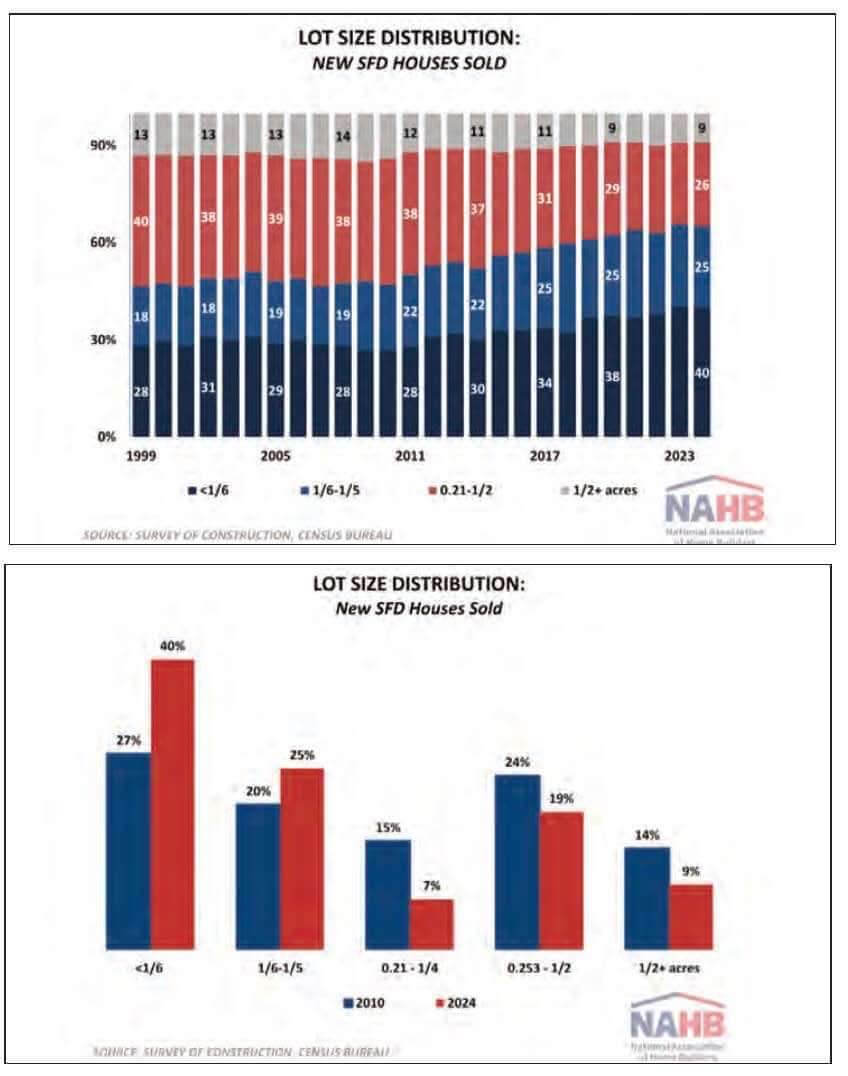
A closer look at the lot size distribution since 2010 reveals that the most dramatic shifts took place at the lowest end, with lots smaller than 7,000 square feet (or under 1/6 of an acre) increasing their share by 13 percentage points. In 2010, 27% of all sold single-family detached homes occupied lots under 1/6 of an acre. The share was not much different from the 1999 recording of 28%. Fast forward to 2024, and the percentage increased to 40%. At the same time, the share of single-family detached spec homes occupying lots between 1/6 and 1/5 acres increased from 20% in 2010 to 25% in 2024.
At the other end of the lot size distribution, the share of spec homes built on larger lots exceeding half an acre shrank from 14% in 2010 to 9% in 2024. The share of homes occupying lots between a quarter and half an acre declined from 24% to 19% over that period. The market share of homes built on lots between 1/5 and 1/4 of an acre lost 8 percent
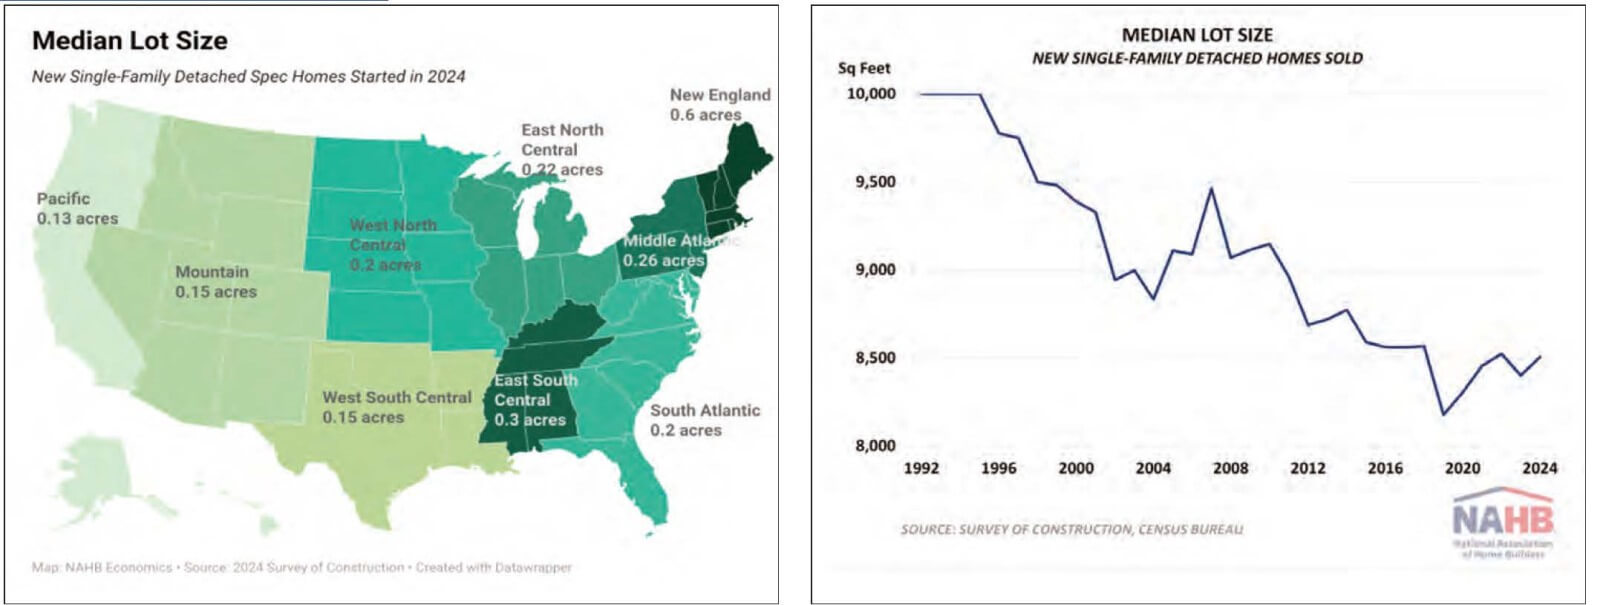
The median lot size of a new single-family detached home sold in 2024 is 8,506 square feet, or just under one-fifth of an acre. This is slightly larger but statistically not different from the lowest on record median of 8,177 square feet set a year before the COVID-19 pandemic.
While the nation’s production of spec homes shifts towards smaller lots, regional differences in lot sizes persist. Looking at single-family detached spec homes started in 2024, the median lot size in New England is three times larger than the national median.
New England is known for strict local zoning regulations that often require very low density. Therefore, it is not surprising that single-family detached spec homes started in New England are built on some of the largest lots in the nation, with half of the lots exceeding 0.6 acres. The East South Central division is a distant second on the list, with the median lot occupying 0.3 acres.
At the other end of the spectrum, the Pacific division, where densities are high and developed land is scarce, has the smallest lots, with half of the lots being under 0.13 acres. The bordering Mountain division also reports typical lots smaller (0.15 acres) than the national median.
In the South, the West South Central division stands out for starting half of single-family detached spec homes on lots under 0.15 acres. This is half the size of typical lots in the neighboring East South Central division.
The analysis above is limited to single-family detached speculatively built homes. Custom homes built on an owner’s land with either the owner or a builder acting as the general contractor do not involve the work of a professional land developer subdividing a property. Therefore, in the case of custom homes, lots refer to an owner’s land area rather than lots in a conventional sense. Nevertheless, the SOC reports lot sizes for custom homes and shows that they tend to have larger lots. The median lot size for custom single-family detached homes started in 2024 is one acre.
For regional analysis, the median lot size is chosen over the average since averages tend to be heavily influenced by extreme outliers. In addition, the Census Bureau often masks extreme lot sizes and values on the public use SOC dataset, making it difficult to calculate averages precisely, but medians (as the midpoint of a frequency distribution) remain unaffected by these procedures.
 |
TECH: Home Building and the Social Media Influencer
Online influencers are reaching members of Gen Z via popular social media site
TikTok may be best associated with the latest dance crazes and viral challenges, but the social media platform with more than 1.5 billion monthly users could be a boon in helping the construction industry find its next generation of skilled laborers.

In fact, many in construction are using the platform to provide younger generations with an informative perspective on careers in the industry and using influencers to help with recruiting. This movement has become a significant influence on Gen Z’s career choices, inspiring many to consider construction as a viable and rewarding profession.
Chelsea Fenton (@thatunionlaborer), a Massachusetts-based TikToker who has worked with The Laborers’ International Union of North America doing concrete, underground utilities and demolition work for more than 13 years, posted her first TikTok after seeing a Facebook reel of a female electrician and noticing the hundreds of comments underneath the post.
“A light bulb went off in my head that I could do this for my trade and I started posting online about construction and being a woman in the trade and it caught the attention of a lot of women,” she said. “I put myself out there and told them if they needed help finding an apprenticeship or some opportunity in their area, message me.”
Today, Fenton has more than 26,500 followers and believes that social media is the best free tool to advertise about the pros of the construction industry, especially for women who might not realize these job options are available.
“The algorithm is easy to push content to a certain demographic of people,” she said. “I have built my community around women — 70% are women — and people hype each other up. TikTok is one of the easiest ways to get a message across to a lot of people.”
Fenton’s posts talk about her growing up in the trades and her experiences throughout her career, and tries to offer an emotional connection, such as when she worked on the jobsite while pregnant.
“If you can make yourself relatable, you will attract people,” she said. “A lot of people don’t really know these are careers that you can do without being $100,000 in debt. My most successful video was me just talking about how much I made, how I bought a house at 27 and showing them the positives.”
Eddy Lopez (@ez_home) owns his own construction business in Washington state and currently has more than 2.6 million followers checking in to his account to see his latest DIY projects and viral construction videos.
“It was during the pandemic when I started posting, at first just for fun, and there were a lot of people who loved the tips and DIY posts, and five years later, the platform is used to run our business,” he said. “Anything you can use to teach people is really good content; people love the before-and-after posts.”
Lopez has had lots of conversations through his posts with those interested in getting into the trade and believes that his TikTok library has helped recruit thousands to the industry.
“You need to hook people right away, and keep things short and simple,” he said about the posts. “If you stay consistent and keep posting, sooner or later, the algorithm is going to reward you.”
A different path
New York-based Andrew Brown (@andrewbrowntrades), founder of ToolFetch, a portal for the trades, has 31,000 followers and utilizes TikTok to inspire the next generation to consider careers in construction.
“My platform is about impact, storytelling and shifting culture in a way that actually helps people,” he said. “TikTok has given me the reach, but more importantly, it’s given this message a real home.”
His posts reach those who feel college might not be the right choice, so content that resonates most involves young men and women on the path to a six-figure career, which includes learning about apprenticeship, union jobs and information on climbing the career ladder. This could include a day-in-the-life post of a welder or electrician or showing jobsites with young people succeeding.
“If people feel they are mechanically driven, have a technical spark or want to work with their hands, they can see that they can get into a career that's in high demand and not have the debt follow them vs. going into a four-year college,” Brown said.
Savvy team-up
A new strategic collaboration between TikTok, the Skilled Careers Coalition and SkillsUSA is looking to boost interest in skilled trades among Gen Z — those born between 1997 and 2012 — by tapping into the influence of creators on the popular platform.
At the heart of the collaboration is Skills Jam, SCC’s youth-led content platform that showcases skilled careers through short- and long-form videos.
“TikTok is great at storytelling; it’s visual with short soundbites in some cases, and it’s a platform that a lot of young individuals are engaging in,” said Mark Hedstrom, executive director of the SCC. “A lot of approach with this collaboration is to meet young students where they’re at, so it’s a great platform to engage them in an authentic way.”
Content that he feels entices younger people to the construction trade are posts by people who look like a student, talk like a student and demonstrate why they are passionate about their skilled career.
“This helps engage the students in exploring the opportunity further,” Hedstrom said. “It’s not just about raising awareness but trying to find opportunities to bring students through to taking action, helping them find those opportunities for them to pursue those careers.”
-Constructiondive.com

• New Home Sales Hold Steady at a Relatively Tepid Level
Challenging affordability conditions, elevated interest rates and economic uncertainty continue to act as headwinds on the housing sector as many potential buyers continue to stay on the sidelines.
Sales of newly built single-family homes edged 0.6% higher in June, rising to a seasonally adjusted annual rate of 627,000, according to newly released data from the U.S. Department of Housing and Urban Development and the U.S. Census Bureau. The past two months have been the slowest sales pace since October of last year, as mortgage rates averaged above 6.8% in June.
“New home sales remained flat last month, highlighting persistent weakness in the housing market despite seasonal expectations for growth,” said Buddy Hughes, chairman of the National Association of Home Builders (NAHB) and a home builder and developer from Lexington, N.C. “Elevated mortgage rates and sustained price levels continue to limit purchasing power, particularly among first-time and middle-income buyers.”
“Despite targeted incentives and pricing adjustments by builders, demand remains tepid, suggesting these measures have had limited impact on overall sales volume,” said Danushka Nanayakkara-Skillington, NAHB’s assistant vice president for forecasting and analysis. And while inventory conditions have stabilized, the flat performance signals continued buyer hesitation and a cautious outlook for the sector. Unless there is a material improvement in financing conditions or household income growth, a near-term acceleration in new home sales appears unlikely.”
A new home sale occurs when a sales contract is signed, or a deposit is accepted. The home can be in any stage of construction: not yet started, under construction or completed. In addition to adjusting for seasonal effects, the June reading of 627,000 units is the number of homes that would sell if this pace continued for the next 12 months.
New single-family home inventory continued to rise with 511,000 residences marketed for sale as of June. This is 1.2% higher than the previous month, and 8.5% higher than a year ago. At the current sales pace, the months’ supply for new homes remained elevated at 9.8 compared to 8.4 a year ago. Completed, ready-to-occupy inventory stood at 114,000 homes in June, up 21.3% from a year ago.
The median new home sale price edged down 4.9% in June to $401,800. This is down 2.9% compared to a year ago.
Regionally, on a year-to-date basis, new home sales are down in all four regions, falling 25.6% in the Northeast, 8.5% in the Midwest, 1.6% in the South and 4% in the West.
• House Bill Restores Funding for Several Housing Programs from Trump Budget
The House Appropriations Committee has voted to restore funding for key housing programs that President Trump eliminated in his “skinny budget,” such as housing choice vouchers, project-based rental assistance and the Community Development Block Grant (CDBG) program.
However, as part of its fiscal 2026 spending bill that covers Transportation, Housing and Urban Development and Related Agencies, lawmakers failed to restore funding for the HOME Investment Partnerships (HOME) program.
NAHB advocated to keep this program at $1.25 billion, which is the current funding level. HOME funds are a critical source of gap financing for Low-Income Housing Tax Credit developments, as well as for homeownership for first-time and low-income home buyers. As the appropriations process moves forward, NAHB will continue to urge lawmakers to restore the HOME program to the fiscal 2025 spending level.
• The House appropriations bill includes:
• $67.75 billion for HUD, which is $939 million below the fiscal 2025 enacted level.
• $35.27 billion for the Tenant-Based Rental Assistance Program, which will maintain housing support for over 2 million households.
• $17.13 billion for Project-Based Rental Assistance, which is a $237 million increase above the fiscal 2025 enacted levels. This funding provides a full renewal of housing contracts serving about 1.2 million households.
• $3.3 billion for the CDBG program.
• $400 billion limitation on guaranteed loans for the Federal Housing Administration’s Mutual Mortgage Insurance Program and $160 million to carry out the program.
• Metals and Equipment Drove Material Prices Higher in June
Residential building material prices rose in June, driven primarily by higher construction machinery and equipment part prices, based on data from the most recent Producer Price Index (PPI). Metal commodities also experienced significant increases, following recently implemented tariffs on steel and aluminum.
Prices for inputs to new residential construction — excluding capital investment, labor, and imports — rose 0.7% in June, following a (revised) flat change in May.
Meanwhile, price growth for services used in construction continues to outpace both domestic and imported goods. The inputs to the New Residential Construction Price Index grew 2.6% from June of last year. The index can be broken into two components: The goods component increased 2.1% over the year, while services increased 3.3%. For comparison, the total final demand index, which measures all goods and services across the economy, increased 2.3% over the year, with final demand with respect to goods up 1.7% and final demand for services up 2.7%.
• Impact of Tariffs
Tariffs on building materials do not directly show up in the PPI data because the PPI measures prices for domestically produced goods and services. In fact, tariffs and taxes are explicitly excluded from the PPI. Despite this, price changes in reaction to tariffs are included in the PPI, meaning price increases to pass on increased costs of materials will show up in this pricing data. Announced tariffs in recent months have resulted in material increases across a few different goods, specifically certain metal products and equipment.
In June, the largest year-over-year price increase was for construction machinery and equipment parts, reporting a 24.2% increase. Meanwhile, metal molding and trim prices were up 15.1%, fabricated steel plate prices were up 13.6%, ornamental and architectural metal work prices were up 9%, and fabricated structural metal prices were up 9% compared to last year. Metal commodities have been the primary targets of tariffs, with 50% tariffs in effect on steel and aluminum products and a potential 50% tariff on copper products coming this August.
• Single-Family Starts Weaken in June as Affordability Challenges Persist
Single-family housing starts declined in June to the lowest rate since July 2024 as elevated interest rates, rising inventories and ongoing supply-side issues continue to act as headwinds for the housing sector.
Due to a solid increase in multifamily production, overall housing starts increased 4.6% in June to a seasonally adjusted annual rate of 1.32 million units, according to a report from the U.S. Department of Housing and Urban Development and the U.S. Census Bureau.
The June reading of 1.32 million starts is the number of housing units builders would begin if development kept this pace for the next 12 months. Within this overall number, single-family starts decreased 4.6% to an 883,000 seasonally adjusted annual rate and are down 10% compared to June 2024. The multifamily sector, which includes apartment buildings and condos, increased 30% to an annualized 438,000 pace.
“Single-family building conditions continued to weaken in June as housing affordability challenges caused builder traffic to move lower as buyers moved to the sidelines,” said Buddy Hughes, chairman of the National Association of Home Builders (NAHB) and a home builder and developer from Lexington, N.C. “Policymakers need to focus on easing high housing costs by eliminating burdensome regulations, promoting careers in the skilled trades, alleviating permitting roadblocks and overturning inefficient zoning rules.”
“Single-family conditions are measurably weakening as resale inventories levels rise, particularly in previously fast-growing areas such as the U.S. south,” said NAHB Chief Economist Robert Dietz. “Single-family home building in the South is down 12.4% on a year-to-date basis, far outpacing declines in the Northeast and the West. However, single-family home building is up 10% on a year-to-date basis in the Midwest, where housing affordability conditions are generally better than much of the nation.”
On a regional and year-to-date basis, combined single-family and multifamily starts were 28.8% higher in the Northeast, 13.1% higher in the Midwest, 8.1% lower in the South and 0.6% lower in the West.
Overall permits increased 0.2% to a 1.40-million-unit annualized rate in June. Single-family permits decreased 3.7% to an 866,000-unit rate and are down 8.4% compared to June 2024. Multifamily permits increased 7.3% to a 531,000 pace.
Looking at regional permit data on a year-to-date basis, permits were 16.9% lower in the Northeast, 8.2% higher in the Midwest, 3.3% lower in the South and 3.7% lower in the West.
The declines for single-family home building have caused the number of single-family homes under construction to level off. There are currently 622,000 single-family homes under construction, which is 6% lower than a year ago. The number of apartments under construction in June, 739,000, is 18.8% lower than a year ago.
ECONOMIC OUTLOOK
NATO Numbers
Among the 31 NATO countries, the one spending the most on defense in 2024, as a percentage of GDP, at 4.12% was Poland, followed by Estonia at 3.43%. In third, the US at 3.38%, trailed by Latvia at 3.15%, then Greece at 3.08%, Lithuania at 2.85%, and Finland at 2.41%. Outside of the US and Greece, the other nations all border Russia or their satellite Belarus. Spain’s 31st at 1.28%.
Harvard Hit
Harvard faces a $1 billion budget shortfall/year should Trump follow through on his threats spanning research, taxes, and enrollment. At 5%, Harvard’s $53 billion endowment yields $2.5 billion/year. However, in FY24 Harvard drew $2.4 billion from it to fund one-third of the budget. Moreover, 80% of the endowment is restricted and 75% is in illiquid private equity, hedge funds and real estate. Harvard will talk big but buckle and negotiate.
Retirement Ratio
The average age of the US population is 40. In 1970, it was 28, in 1980 it was 30, and in 2020 it was 38. When your workforce stagnates while your retiree population explodes, problems ensue. Currently, there are slightly over two people in the prime working-age labor force to support every retiree. By 2035, the dependency ratio will be 1.8. Entitlements, unless soon dealt with, will fiscally swamp us.
Tariff Totals
While we can argue if households, firms, or manufacturers effectively pay tariffs, the data is in. From 1/1/25-5/31/25, California businesses paid $11.3 billion in tariffs. Texas was a distant second at $6 billion, then Michigan at $3.3 billion. 14 more states paid over $1 billion in tariffs. 11 states paid less than $100 million, with Alaska and Wyoming taking the smallest hits at just over $16 million each.
Less Lovely
June net employment growth was decently 147,000, April and May were revised up by 16,000, and the unemployment rate fell to 4.1%, but curb your enthusiasm. The unemployment rate declined because the labor force participation rate slid. Moreover, the workweek declined, and hourly earnings growth declined M-o-M from 0.4% to 0.2% and Y-o-Y from 3.9% to 3.7%, not signs of a strong market. The headline prevents a July rate cut.
Tariff Totals
While we can argue if households, firms, or manufacturers effectively pay tariffs, the data is in. From 1/1/25-5/31/25, California businesses paid $11.3 billion in tariffs. Texas was a distant second at $6 billion, then Michigan at $3.3 billion. 14 more states paid over $1 billion in tariffs. 11 states paid less than $100 million, with Alaska and Wyoming taking the smallest hits at just over $16 million each.
Statistical Skepticism
June net employment growth will be reported 7/3/25. Importantly, the number that comes out is preliminary. There’ll be a first revision in August, a second revision in September. In August there will also be a preliminary “benchmark” revision (based on the Quarterly Census of Employment and Wages, and which is likely to be quite negative) for data for the year ending 3/24 followed by a final benchmark revision in 2/26.
Less Lovely
June net employment growth was decently 147,000, April and May were revised up by 16,000, and the unemployment rate fell to 4.1%, but curb your enthusiasm. The unemployment rate declined because the labor force participation rate slid. Moreover, the workweek declined, and hourly earnings growth declined M-o-M from 0.4% to 0.2% and Y-o-Y from 3.9% to 3.7%, not signs of a strong market. The headline prevents a July rate cut.
Elliot Eisenberg, Ph.D. is an internationally acclaimed economist and public speaker specializing in making economics fun, relevant and educational. Dr. Eisenberg earned a B.A. in economics with first class honors from McGill University in Montreal, as well as a Master and Ph.D. in public administration from Syracuse University. Eisenberg is the Chief Economist for GraphsandLaughs, LLC, a Miami-based economic consultancy that serves a variety of clients across the United States. He writes a syndicated column and authors a daily 70-word commentary on the economy that is available at www.econ70.com.
|
|
 |