Vol. 2025, Issue 8 - Builders Outlook

America’s Housing Supply Crisis: Is the Suburban Frontier Closing?
NAHB
The spring home-buying season died on the vine. However, there are some signs that sales activity could heat up this summer. Here’s a look at what’s happening in the housing market.
The American housing market is facing a persistent shortage of inventory. Home prices have reached historic highs, and affordability has declined. Normally, in response to higher prices, housing supply would increase. However, new home construction has not kept pace with population growth and household formation, especially following the surge of demand in the wake of the pandemic.
Recent research has claimed that the relationship between prices and supply has become diluted over time because of regulatory barriers and political dynamics. A working paper, “America’s Housing Supply Problem: the Closing of the Suburban Frontier?” by economist Edward Glaser and Joseph Gyourko, dives into why the supply of new housing has shifted lower, especially in the sunbelt regions like Dallas, Atlanta, and Phoenix.
This research shows that the once-strong link between increasing home prices and new home constructions has weakened or even reversed in many metro areas. The authors analyzed Census tract data from the 1970s to the 2010 to track how construction has responded to price changes over time. Housing markets that used to expand rapidly in response to higher prices are now largely unresponsive.
The authors use prices and density to explore where and why new housing is built. The results show that housing supply growth has slowed significantly in low-density areas, particularly in the areas with higher home prices, where much of the housing expansion would traditionally have been expected. This shift reflects the growing impact of regulatory barriers, as suburban and low-density areas now face stricter zoning, and longer permitting processes. These factors make building more homes more difficult and less responsive to demands or market signals.
Land use regulations, zoning restrictions and permitting processes have become more restrictive since the 2000s. These constraints increase the cost and difficulty of building new homes, even as home prices increase. NAHB research shows that regulations now account for nearly $94,000 of the average new home price.
Local socioeconomic dynamics also factor into housing inventory as NIMBYism has hampered supply. As neighborhoods become more affluent, wealthier or, in some cases, higher-educated residents are more likely to oppose new development through changing the permit environment or increasing zoning restrictions.
|
|


Lending Trends
Navigating Mortgage Market Volatility and Building Toward Solutions
As we approach the end of summer, our industry continues to face headwinds in the mortgage sector that impact both homebuyers and builders alike. Mortgage rates remain stubbornly high compared to recent historical norms, hovering between 6.75% and 7.25% across most conventional loan products. These elevated rates, driven by ongoing inflationary pressures and uncertainty in the Federal Reserve’s policy, have significantly reduced affordability for many first time buyers and move up homeowners across Texas.
In El Paso, the effects are being seen firsthand. The volume of mortgage applications has declined, and many builders are adjusting their product lines, offering more compact, cost efficient models to meet the market where it is. There is also growing interest in creative financing strategies: rate buydowns, adjustable rate mortgages, and seller incentives have become critical tools in keeping deals alive.
But this is not just a local phenomenon. Across Texas, builder confidence has dipped slightly, according to the latest Texas Housing Insight report from the Texas Real Estate Research Center. While overall housing inventory remains low, helping stabilize prices, demand is being choked by financing challenges. Despite strong job growth and population inflows into the state, buyers are hitting a wall when it comes to monthly mortgage payments.
There are bright spots. The Texas Legislature is exploring housing related legislation aimed at expanding access to workforce housing and reducing regulatory burdens. Locally, efforts are underway with city planners to streamline permitting processes and advocate for infrastructure investment in growth corridors. Additionally, some Texas credit unions and regional banks have launched pilot programs offering more flexible lending criteria to help buyers close the gap.
As president of the El Paso Association of Home Builders, I remain optimistic that with coordinated advocacy, innovation, and resilience, the industry can adapt to the current challenges and build a stronger, more accessible housing market for our community. I urge all members to stay engaged, whether through committee work, legislative outreach, or simply by sharing experiences, because our voices are more powerful together.
Let us keep building El Paso, smartly, sustainably, and with purpose.
 |
Executive Message • RAY ADAUTO

Summer fades away
EPAB strength to face all seasons is in our membership
The EPAB is nothing without members. This is the biggest secret to an association, a secret that at times challenges even the most involved members. What we are is pretty basic, a group of liked minded people in a particular interest in residential construction.
I get calls and emails asking about whether or not someone is a member, but also from real estate agents trying to figure out the same thing. What does this have in common? I think it is clear that membership brings up confidence with consumers and professionals. This is one reason why membership is important, but not the only reason. What surprises me is that even long-time members, both builder and associate, do not proclaim or advertise membership. Do yourself a favor. Let people know. It’ll place your company in a professional class and let people know you care about your industry.
Summer is over. Too quick, but then in my day the summer started in May and ended officially at the Seminarian Bazaar on Labor Day. Back then my dad and mom would schedule a two week vacation to visit somewhere, normally California. Loved Disneyland and Knots, the beach, and maybe even Catalina Island. Most of all we got to visit family. It wasn’t as cool back then, but now I wish I could see them again. Time has taken so many, and those left wouldn’t know we’re cousins if their life depended on it. So as we start Fall, let me raise a toast to those booklets of E tickets, the wowzer of Huntington Beach, and the warmest hearts I will ever remember. For you youngsters, you’ll treasure times you have now, if you love life. So grab the brass ring, study hard, work hard. It comes to an end too quickly.
 |
Is U.S. Lumber Self-Reliance Possible?
By Jesse Wade, June 2025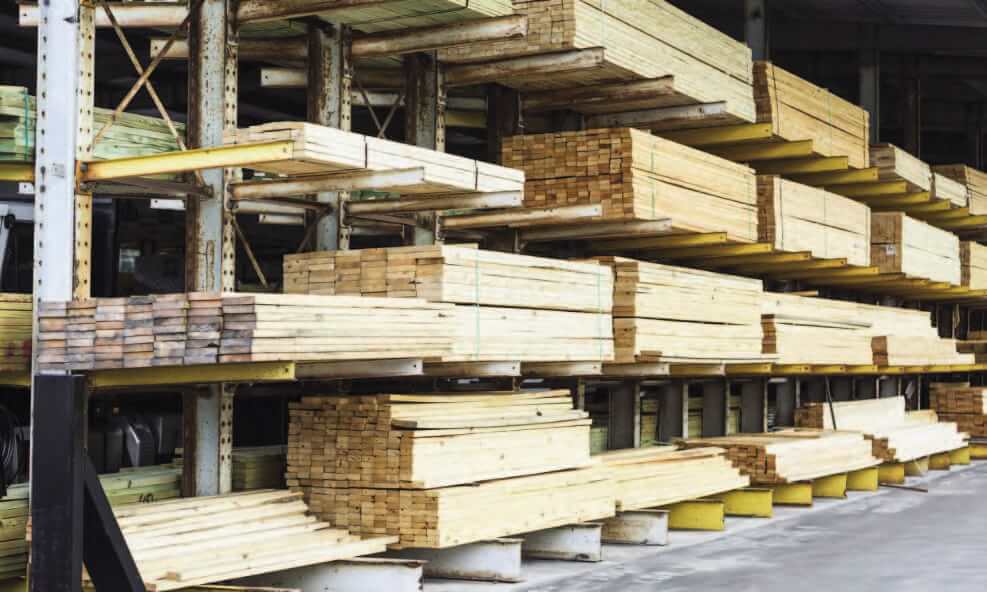
Lumber cost uncertainty has risen from the start of the year, driven in part by potential higher tariffs, particularly on Canadian softwood lumber. Despite the continued use and threat of tariffs, U.S. sawmill and wood preservation firms have not increased production to a level that replaces imports. In fact, utilization rates continue to fall, meaning they have the capacity to produce more lumber but are simply not operating at that level.
As these firms produce at lower levels, their employment has fallen over the past few quarters. At the same time, reduced foreign competition and artificially higher prices have lessened the incentive for firms to expand output, even as demand remains high. As a result, U.S. mills remain unable to meet the nation’s full lumber consumption needs.
In the first quarter of 2025, sawmill and wood preservation firms continued to report lower capacity utilization coupled with stagnant production. The utilization rate, a ratio of actual production and potential production, was 64.4% in the first quarter on a four-quarter moving average basis. The utilization rate has continued to drop since 2017, as capacity (or the capability to produce) has increased, but production has remained lower than in 2018.
By combining the Federal Reserve’s production index and the Census Bureau’s utilization rate, we can compose a rough index estimate of what the current production capacity is for U.S. sawmills and wood preservation firms. Shown below is a quarterly estimate of the calculated production capacity index with production index and utilization rate estimates.
Based on the data sawmill capacity has increased from 2015 but remains lower than peak levels in 2011. Most of the recent capacity gains took place in 2023, followed by little gain over the course of 2024. As evident above, there is ample room to increase production of domestic lumber, but current production levels remain much unchanged over the past several years. Looking at the Producer Price Index, lumber prices remain higher than 2024. At current pricing levels, producers may see no benefit of increasing output, as it would push prices lower since demand has fallen from the start of the year. Notably, even when prices were historically high in 2021 and 2022, producers were unable to increase their production significantly during these periods, potentially due to supply chain disruptions.
Employment at sawmills and wood preservations firms fell again in the first quarter to 88,533 workers. This marks the third consecutive quarter where employment fell in this industry. Tariff policies to protect the U.S. lumber industry have been in place since 2017 in the form of antidumping/countervailing duties. Tariff policies are typically intended to provide stability to the industry and increase employment but here, we are seeing the opposite effect.
These policies specifically place duties on imports of Canadian softwood lumber, where nearly a quarter of the U.S. softwood lumber supply originates. The current AD/CVD rates on Canadian softwood lumber are expected to double this fall to over 30%. Due to U.S. lumber production remaining level since the initial tariff policies were enacted in 2017, doubling these duty costs will likely not increase supply but simply increase costs.
 |

NAHB
Private residential construction spending fell by 0.7% in June, marking the sixth straight month of decreases. This decline was primarily driven by reduced spending on single-family construction. Compared to a year ago, total spending was down 6.2%, as the housing sector continues to navigate the economic uncertainty stemming from ongoing tariff concerns and elevated mortgage rates.
According to the latest U.S. Census Construction Spending data, single-family construction spending declined by 1.8% in June. This decrease aligns with the weak single-family starts in June and the third lowest reading of NAHB/Wells Fargo Housing Market Index (HMI) since 2012. Compared to a year ago, single-family construction spending decreased by 5.3%. Meanwhile, multifamily construction spending stayed flat for the month but continued to follow the downward trend that began in mid-2023. Compared to June 2024, multifamily spending was down 9.5%. Improvement spending (remodeling) was up 0.5% in June but was 6.1% lower on a year-over-year basis.
The NAHB construction spending index is shown in the graph below. The index illustrates how spending on single-family construction has slowed since early 2024 under the pressure of elevated interest rates and concerns over building material tariffs. Multifamily construction spending growth has also slowed down after the peak in July 2023. Additionally, improvement spending has been weakening since the beginning of 2025.
Meanwhile, spending on private nonresidential construction was down 4% over a year ago. The annual private nonresidential spending decrease was primarily driven by a $14.7 billion drop in the manufacturing category, followed by a $13.7 billion decrease in commercial construction spending.
NAHB Market Update: Eye on Housing
Existing Home Sales Retreat to 9-Month Low
Existing home sales fell to 9-month low in June as home prices hit another monthly record high, according to the National Association of Realtors (NAR). Sluggish pace of sales suggest that higher mortgage rates and elevated home prices are continuing to sideline buyers, despite improved inventory conditions.
Mortgage rates have hovered between 6.5% and 7% due to ongoing economic and tariff uncertainty this year, prompting the Fed to pause interest rate cuts. With mortgage rates expected to stay above 6% for longer due to an anticipated slower easing pace in 2025, these prolonged higher rates and high home prices would continue to weigh on the market. As such, sales are likely to remain limited in the coming months.
Total existing home sales, including single-family homes, townhomes, condominiums, and co-ops, fell 2.7% to a seasonally adjusted annual rate of 3.93 million in June, the lowest level since October 2024. On a year-over-year basis, sales were unchanged from a year ago.
The existing home inventory level was 1.53 million units in June, down 0.6% from May, but up 15.9% from a year ago. At the current sales rate, June unsold inventory sits at a 4.7-months’ supply, up from 4.6-months in May and 4.0-months in June 2024. Inventory between 4.5 to 6 month’s supply is generally considered a balanced market.
Homes stayed on the market for a median of 27 days in June, unchanged from May but up from 22 days in June 2024.
The first-time buyer share was 30% in June, unchanged from May but up 29% from a year ago.
The June all-cash sales share was 29% of transactions, up from 27% in May and 28% a year ago. All-cash buyers are less affected by changes in interest rates.
The June median sales price of all existing homes was $435,300, up 2.0% from last year. This marked an all-time high for the month of June and the 24th consecutive month of year-over-year increases. The median condominium/co-op price in June was up 0.8% from a year ago at $374,500. Recent gains for home inventory will put downward pressure on resale home prices in most markets in 2025.
Geographically, three of the four regions experienced a decline in existing home sales in June, with a decrease of 2.2% in the South, 4.0% in the Midwest, and 8.0% in the Northeast.
Meanwhile, sales in the West rose 1.4%. On a year-over-year basis, sales were up in the Midwest (2.2%) and the South (1.7%) but were down in the West (-4.1%) and the Northeast (-4.2%).
The Pending Home Sales Index (PHSI) is a forward-looking indicator based on signed contracts. The PHSI rose from 71.3 to 72.6 in May, suggesting a solid labor market is supporting the market despite the elevated mortgage rates. On a year-over-year basis, pending sales were 1.1% higher than a year ago, per National Association of Realtors data.
Core Inflation Accelerates Amid Tariff Pressure
Inflation held steady at 2.7% in July as food and energy prices remained subdued and offset increases in service prices, according to the latest Bureau of Labor Statistics (BLS) report. Core inflation, which excludes volatile food and energy, picked up its largest monthly increase since January and fastest annual pace since February.
During the past 12 months, on a non-seasonally adjusted basis, the Consumer Price Index (CPI) rose by 2.7% in July, unchanged from June and the highest since February 2025. Excluding the volatile food and energy components, the “core” CPI increased by 3.1% over the past 12 months. A large portion of the “core” CPI is the housing shelter index, which increased 3.7% over the year — the lowest reading since October 2021. Meanwhile, the component index of food rose by 2.9%, and the energy component index fell by 1.6%.
On a monthly basis, the CPI rose by 0.2% in July (seasonally adjusted) after a 0.3% increase in June. The “core” CPI increased by 0.3% in July.
The index for shelter continued to be the largest contributor to the monthly increase. This index constitutes more than 40% of the “core” CPI, rising by 0.2% in July, following the same increase last month.
Other top indexes that rose in July include:
• Medical care (+3.5%),
• Airline fares (+4.0%),
• Recreation (+0.4%),
• Household furnishings and operation (+3.4%), and
• Used cars and trucks (+0.5%).
Meanwhile, the index for lodging away from home (-1.0%) and communication (-0.3%) were among the few major indexes that decreased over the month.
Custom Home Building Grows as Broader Housing Market Struggles
An analysis of census data by NAHB economists shows that custom home building grew 4% in the second quarter of 2025 as high interest rates and home prices suppress demand for traditional spec home production.
There were 54,000 total custom building starts during the second quarter of 2025. Over the last four quarters, custom housing starts totaled 184,000 homes, up 2% from the previous period.
The current market share of custom-built homes is approximately 19% of total single-family starts, the highest since 2022, but still far short of the 31.5% set during the second quarter of 2009 when production home building cratered following the housing market collapse.
As NAHB Chief Economist Dr. Robert Dietz notes in this Eye on Housing post, the custom home building market is less sensitive to the mortgage interest rate cycle than other forms of home building, but is more sensitive to changes in household wealth and stock prices. With spec home building down and the stock market up, custom building is gaining market share.
Single-Family Starts Edge Higher but Affordability Challenges Persist
Single-family housing starts posted a modest gain in July as builders continue to contend with challenging housing affordability conditions and a host of supply-side headwinds, including labor shortages, elevated construction costs and inefficient regulatory costs.
Led by solid multifamily production, overall housing starts increased 5.2% in July to a seasonally adjusted annual rate of 1.43 million units, according to a report from the U.S. Department of Housing and Urban Development and the U.S. Census Bureau.
The July reading of 1.43 million starts is the number of housing units builders would begin if development kept this pace for the next 12 months. Within this overall number, single-family starts increased 2.8% to a 939,000 seasonally adjusted annual rate and are down 4.2% on a year-to-date basis. The multifamily sector, which includes apartment buildings and condos, increased 9.9% to an annualized 489,000 pace.
“Single-family production continues to operate at reduced levels due to ongoing housing affordability challenges, including persistently high mortgage rates, the skilled labor shortage and excessive regulatory costs,” said Buddy Hughes, chairman of the National Association of Home Builders (NAHB) and a home builder and developer from Lexington, N.C. “These headwinds were reflected in our latest builder survey, which indicates that affordability is the top challenge to the housing market.”
“The slowdown in single-family home building has narrowed the home building pipeline,” said NAHB Chief Economist Robert Dietz. “There are currently 621,000 single-family homes under construction, down 1% in July and 3.7% lower than a year ago. This is the lowest level since early 2021 as builders pull back on supply.”
On a regional and year-to-date basis, combined single-family and multifamily starts were 10.2% higher in the Northeast, 17.7% higher in the Midwest, 2.4% lower in the South and 0.5% lower in the West.
Overall permits decreased 2.8% to a 1.35-million-unit annualized rate in July. Single-family permits increased 0.5% to an 870,000-unit rate and are down 5.8% on a year-to-date basis. Multifamily permits decreased 8.2% to a 484,000 pace.
Looking at regional permit data on a year-to-date basis, permits were 16.6% lower in the Northeast, 9.1% higher in the Midwest, 3.4% lower in the South and 5.1% lower in the West.
Powell Power
The critical thing about Powell’s talk tomorrow is tone. Can he really offer dovish rate guidance? Equities are at/near record highs, credit spreads are near their tightest ever, the dollar at its lowest level in years, unemployment is just 4.2%, inflation expectations are at 2.4%, well above the 2% target, and 25Q3 GDP growth is forecast to be over 2% by the FRB of Atlanta and NY. Color me skeptical.
Weakening Wages
Pre-2015, wage growth was consistently higher for high-income workers than low-income ones. Starting in 2015, that began to reverse, and during Covid that new relationship was turbo-charged. Income growth for the bottom fifth of the population at times was twice as fast. Since late 2024, the old relationship has returned, with higher income earners gaining pay raises of roughly 1.5% to 2% more, a large amount, compared to the low-paid.
Consumer Consumption
During the year ending 7/25, spending increased 2% for the top third of households, those earning over $120,000/year, 1% for the middle third of households, and was zero, or zilch for the bottom third of households, those earning roughly $50,000/year or less. Consumer spending is almost 70% of overall GDP and it’s increasingly being done by the better off, due to better wage growth and substantially more capital gains.
Tail Tally
In 2025, Americans are expected to spend $157 billion on their pets, 62% more than in 2019. $67.1 billion will be spent on pet food/treats, $41.4 billion on veterinary care and products, $34.3 billion on supplies, live animals & OTC meds, and $13.5 billion on other. While pet food costs are up 20% since Covid, pet services like veterinary bills and grooming services are 42% more costly.
Consumer Consumption
During the year ending 7/25, spending increased 2% for the top third of households, those earning over $120,000/year, 1% for the middle third of households, and was zero, or zilch for the bottom third of households, those earning roughly $50,000/year or less. Consumer spending is almost 70% of overall GDP and it’s increasingly being done by the better off, due to better wage growth and substantially more capital gains.
Increasing Inflation
After steadily falling since mid-2022, inflation is again rising. Last month, Y-o-Y import prices rose at their fastest pace this year, Y-o-Y wholesale prices rose at the fastest pace in three years, and Y-o-Y wholesale vegetable prices rose 39% last month. Annual inflation as measured by the CPI has now risen three straight months, all while the labor market weakens. Tariffs are starting to slowly make their presence felt.
Elliot Eisenberg, Ph.D. is an internationally acclaimed economist and public speaker specializing in making economics fun, relevant and educational. Dr. Eisenberg earned a B.A. in economics with first class honors from McGill University in Montreal, as well as a Master and Ph.D. in public administration from Syracuse University. Eisenberg is the Chief Economist for GraphsandLaughs, LLC, a Miami-based economic consultancy that serves a variety of clients across the United States. He writes a syndicated column and authors a daily 70-word commentary on the economy that is available at www.econ70.com.
|
|